Find optimal resolution for your data
Resolution Sweep: Human PFC
In this example, we explore a dataset which contains heterogeneity between celltypes which is only present when cells are represented at high enough resolution (<500kb bins).
Including the argument --resolution_sweep will start from your initial resolution and utilize the Cooler.coarsen_cooler function to bin the data to successive lower resolutions.
Starting from ~200kb resolution, this sweep will cover 200kb, 400kb, 600kb, 800kb, 1Mb, 2Mb, 3Mb, and 4Mb.
{
   "embedding_algs": [
      "InnerProduct",
      "fastHiCRep",
      "1d_pca"
   ],
   "dset": "pfc",
   "resolution_sweep": true,
   "scool": "data/scools/pfc_200kb.scool",
   "n_runs": 5
}
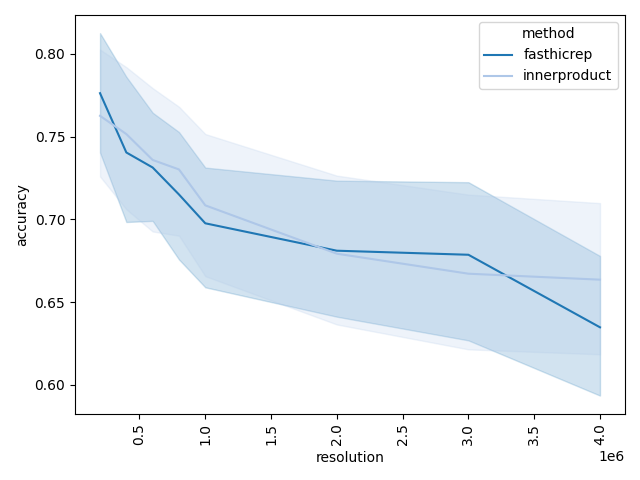
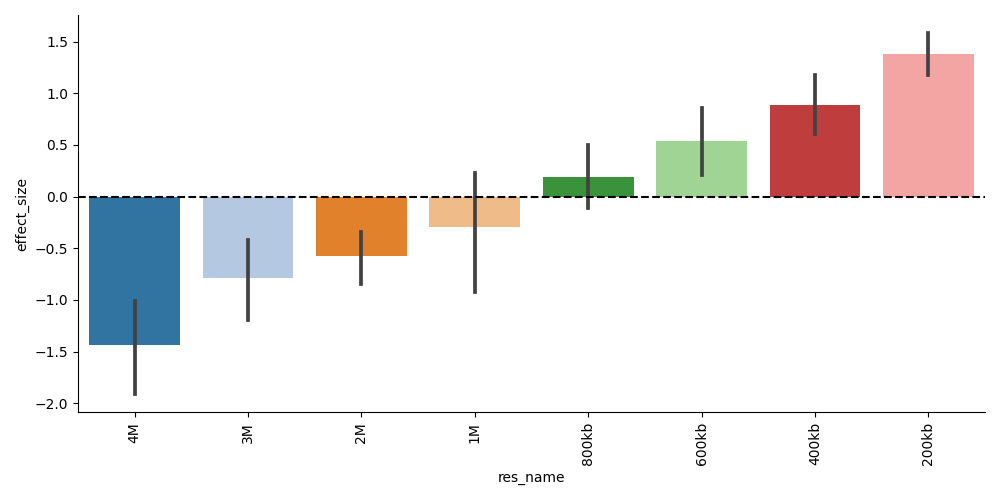
Since we have ground-truth celltype labels to compare with in this dataset, the main plot of interest is either the clustering accuracy vs. resolution plot or the per-resolution effect size plot:


The clustering accuracy plot shows diminishing performance as we decrease the resolution, and we can inspect the embedding visualizations to determine the culprits:
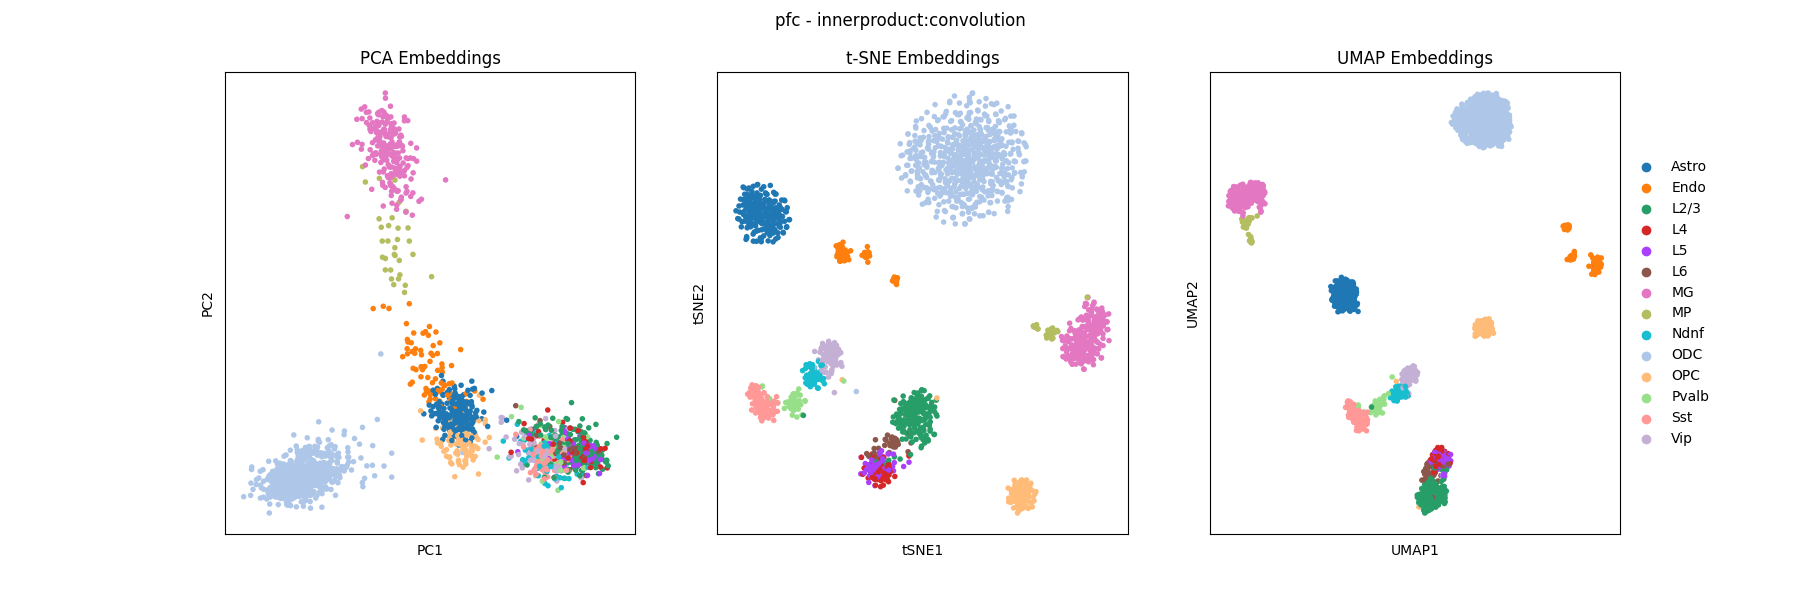
The best embedding in this sweep was achieved by InnerProduct at 200kb:

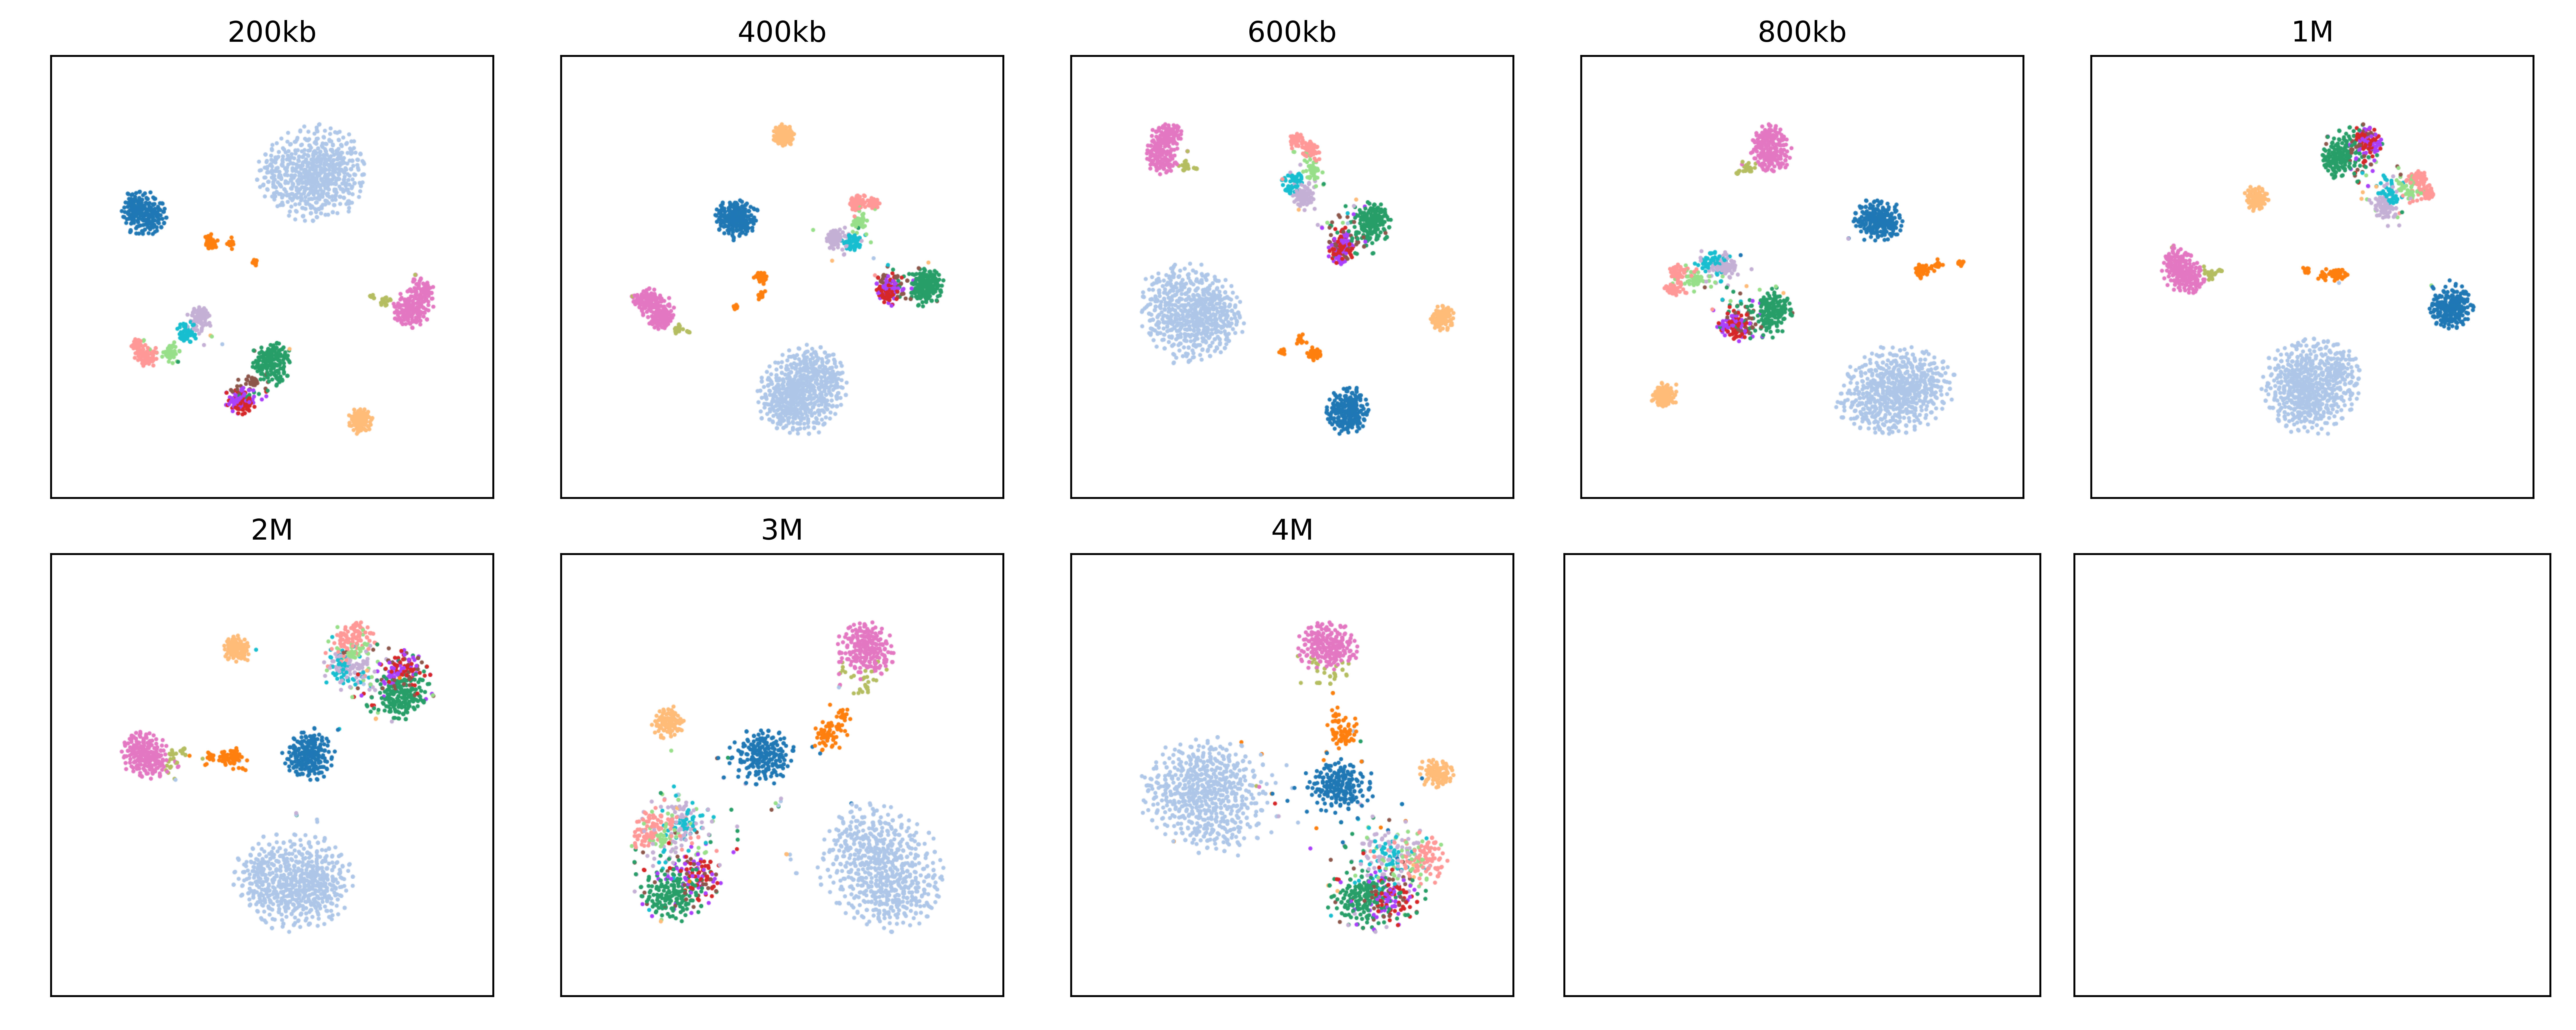
Already we can see that L2/3, L4, L5, and L6 are highly self-similar along with with Vip, Pvalb, Sst and Ndnf. We can inspect the innerproduct_resolution_tsne figure and see that as we increase resolution, it is these groups of cell types which become harder to separate:

This is because the L2/3, L4, L5, and L6 cell types are all very similar in terms of their large-scale domain organization, but at higher resolution we can identify short-range intra-domain differences which help distinguish them.