Compare many methods on your data
One of the main benefits of scloop is you can easily run multiple methods sequentially and combine base preprocessing steps with separate embedding methods. For each baseline though, we can first apply preprocessing steps to each contact matrix. Just append + to the method name and then list the preprocessing steps separated by commas. A full list of preprocessing steps implemented is available in the scloop.preprocessing module. Note that some preprocessing steps yield matrices which are incompatible with certain methods.
Prepare configuration file
In the example below, we demonstrate how in some datasets, the most important decisions are the preprocessing steps rather than the embedding method itself. Simply running each method by default will show scHiCluster as one of the only methods able to separate the oocytes and zygotes. However, if we apply the same or similar preprocessing steps as scHiCluster (coverage correction, convolution, random walk, and quantile filtering), we can see that simple baseline methods, even those that throw away the 2D cell information are able to separate the oocytes and zygotes as well.
{
   "embedding_algs": [
      "1d_pca",
      "2d_pca",
      "1d_pca+quantile_0.99",
      "2d_pca+quantile_0.99",
      "1d_pca+vc_sqrt_norm,convolution,random_walk,quantile_0.99",
      "2d_pca+vc_sqrt_norm,convolution,random_walk,quantile_0.99",
      "1d_pca,google",
      "2d_pca,google",
      "2d_pca+quantile_0.99,google",
      "2d_pca+quantile_0.99,google",
      "scHiCluster",
      "fastHiCRep",
      "fastHiCRep+vc_sqrt_norm,convolution,random_walk,quantile_0.99"
   ],
   "dset": "oocyte_zygote_mm10",
   "scool": "data/scools/oocyte_zygote_mm10.scool",
   "reference": "data/oocyte_zygote_mm10_ref"
}
Interpret results
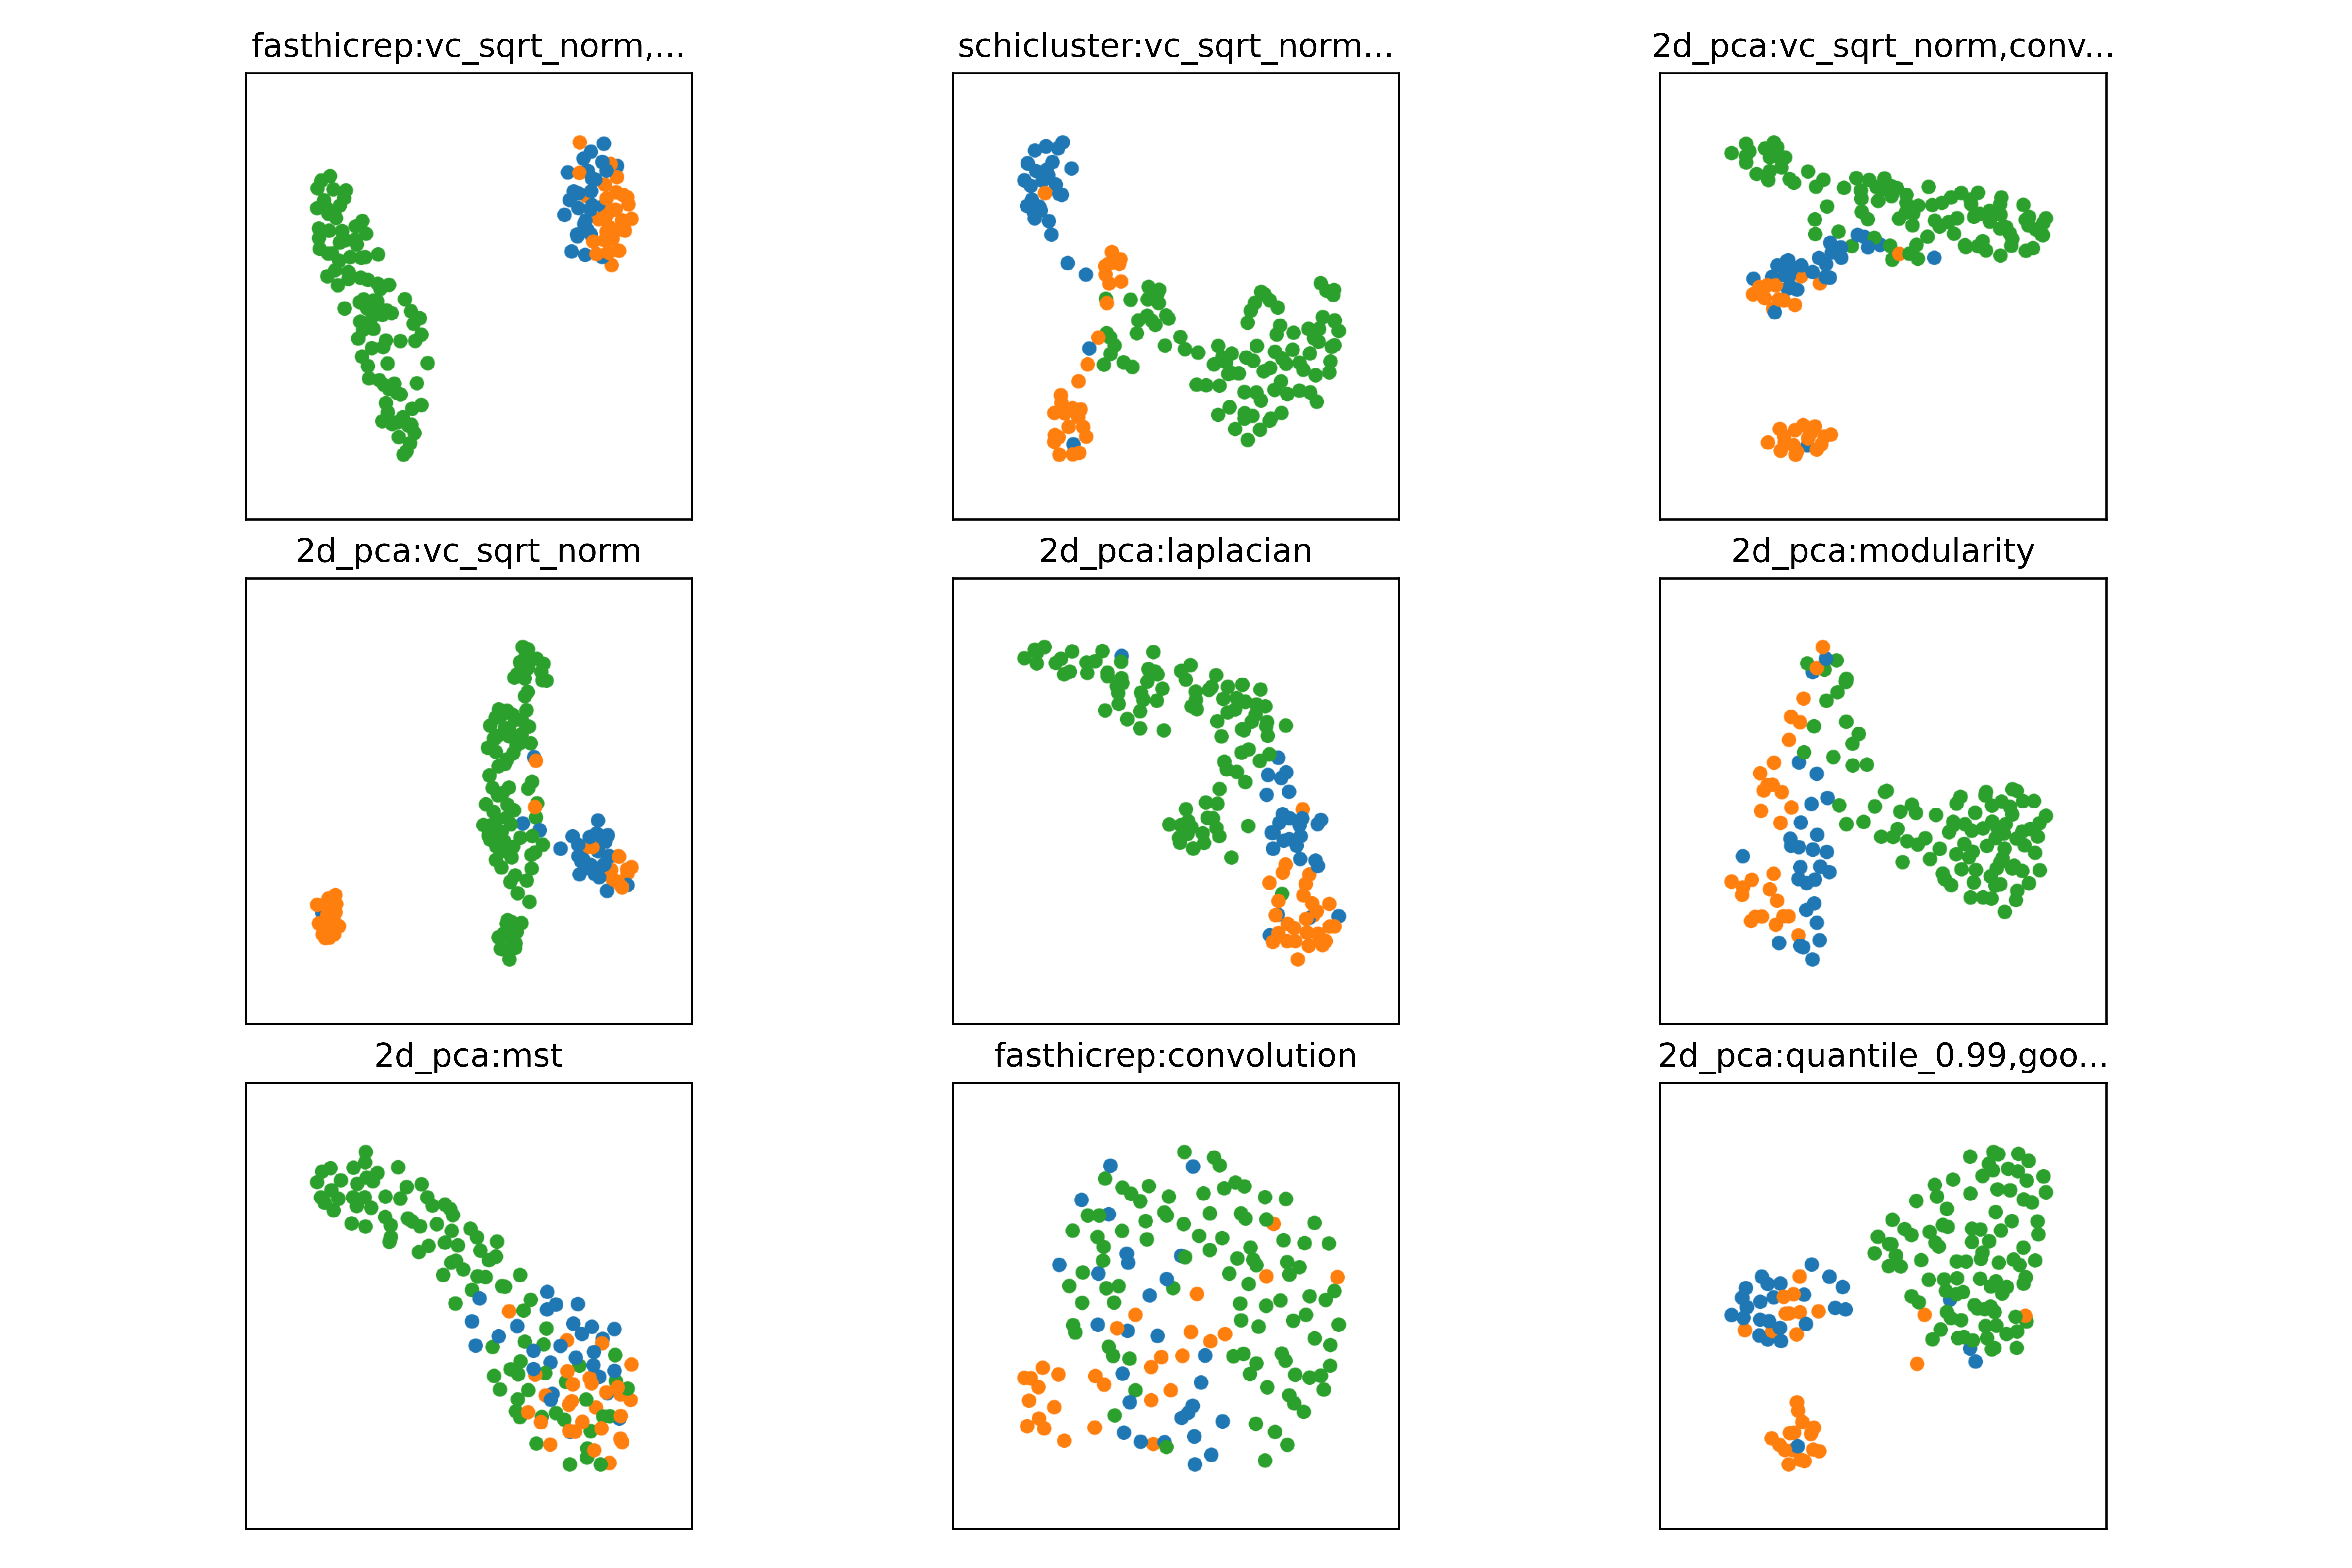
If multiple embedding methods are specified, scloop will automatically generate comparisons of each embedding visualization (UMAP shown below):
If celltype labels are supplied, scloop will also perform a clustering analysis to compare the different methods and determine if any methods significantly over/under-perform:
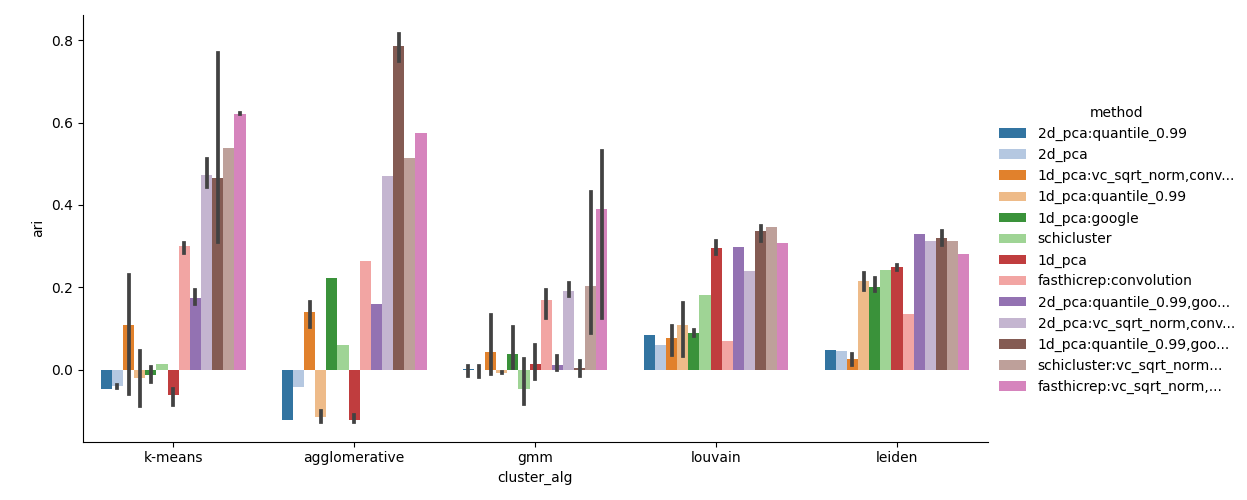
By default we run both the Leiden and Louvain clustering algorithms which automatically infer the number of clusters. If the number of celltypes/clusters is known ahead of time, we additionally run K-Means, Agglomerative Hierarchical Clustering, and a Gaussian Mixture Model (GMM). The default metric used to evaluate performance is the Adjusted Rand Index (ARI), but we also provide additional clustering metrics and the Average Circular ROC (ACROC) metric specific to scHi-C data with cyclic or continuous properties such as the cell cycle.
This can also be accomplished after running embedding methods separately using the compare command:
scloop compare --dset oocyte_zygote_mm10 --scool data/scools/oocyte_zygote_mm10.scool
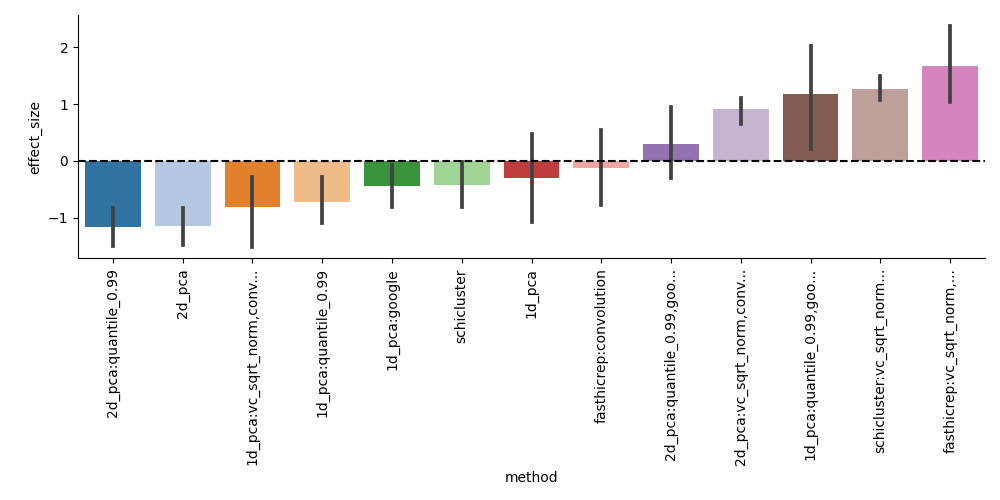
If each method is run multiple times (we recommend at least 3), then scloop will perform hypothesis testing to determine if any methods significantly outperform the others: This will produce a set of test statistics for each method, and a p-value for each method compared to the other methods (optionally separated by choice of clustering algorithm).
Note that you can also combine functionalities and overwrite parameters from the JSON file:
scloop embed --dataset_config oocyte_zygote_mm10.json --embedding_algs higashi 3dvi VaDE --latent_dim 128